
Churn rates are both a challenge and opportunity for event directors. One of our engineers runs an incredibly popular cyclocross race at the end of the New England race season each year. Half race and half party, riders love the food trucks as much as they enjoy the competition. Yet despite having a cult-like following their year-over-year return rate is only slightly higher than other events in the area. Even events that sell out each year still deal with a certain amount of churn.
That may feel frustrating, but it’s also an opportunity. Once you understand your event’s churn rate and dig deeper into the reasons, you’ll also begin to identify things you can do about it. Let’s start by looking at the data.
Average Churn Rates by Sport
The chart below represents averages across the roughly 4,000+ events managed using the athleteReg platform. Average churn rate is defined as what percentage of participants from one year didn’t come back and participate the following year.
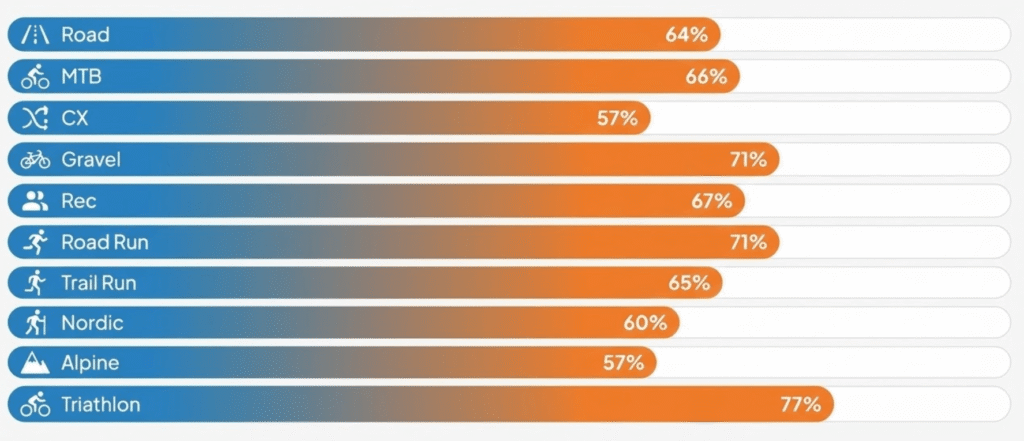
There are a handful of factors that drive some of these differences. Some events like alpine ski races lean heavily toward the high school and collegiate level where racers are only eligible for a few years, others require overnight travel that can be hard to manage year after year, and then there is the natural churn of people who simply lose interest in a sport over time.
There are dozens of reasons beyond those, so rather than treat this chart above as the final answer, I’d recommend you treat it as a starting point for three additional steps.
1. Find Your Event’s Churn/Return Rate
If you’re using the athleteReg platform, you can easily check your churn rate from the Email Past Participants tab. You can even break this down by age, gender, or other options available to your participants to see how each group’s churn rate compares. If you’re not using athleteReg and your platform doesn’t make this possible, try exporting the email addresses of participants from two different events and using a tool like Excel or an free, online “compare two lists” tool to analyze the overlap.
2. Don’t Panic if Your Churn Rate is High
Remember that the chart above contains averages of all events and races like yours may only be a subset of that group. For example, if your event requires a large number of participants to travel, the cost of airfare and hotels will always tend to push your churn rate upward. This is also true if you run an event for more casual participants who may not be as committed to the sport. Benchmarks like the one above are helpful, but just like in a race, the most important number to compare against is yourself.
3. Survey to Find Opportunities to Improve
One reason our churn rate insights are found in the email toolset is because we want you to be able to take action immediately on what you learn. In this case, create simple surveys that get at the heart of why each group behaves the way they do.
- Have you asked first time participants why they registered?
- Have you asked what the highlights or lowlights were of their experience?
- If people have come multiple years in a row, have you asked them why?
- If they didn’t return, have you asked them why not?
Once you identify a few issues to fix or bright spots to build on, spend time brainstorming ways to address each one.
Measure, Brainstorm, Try
Your churn rate will never reach 0%, but there are almost always ways to improve your event to help participants have a better experience and be more likely to return. Here are a few ideas to get the wheels turning.
1. Open Next Year Before the Event
On the simplest level, one of the best ways I’ve found to decrease churn rate is to open registration for next year’s even during this year’s. It’s a great way to capitalize on that post-event high.
2. Race X, Get 1 Free
This is especially helpful for a race series, but it can also be effective when applied over multiple years. Knowing that their fees will be covered if they can get a streak going can motivate people to keep coming back.
3. Exclusive Streak Benefits
Streaks in general can be a powerful tool. Look for ideas like guaranteed entry, extra swag, early registration, and registration discounts based on how many years in a row they’ve participated.
4. Visible Streak Benefits
Another thing some events do is make these benefits very visible like a special belt buckle, shirt, or bib. This helps build the streak into a visible community that other participants will see and aspire to.
5. Year-Round Engagement
Remember that even if you events only happen at certain times of the year, the rest of the year is a great opportunity to find ways to stay engaged with your community through updates, stories, and other content that keeps your race top of mind.
Have you seen specific ideas from races that do a great job of brining back participants year after year? Let us know. And don’t forget to click here and join our newsletter so you don’t miss tips like these.