
For event directors there are already a lot of things on your plate as you prepare for your event; just the task of setting up registration can be daunting enough. However, to take your event to the next level it’s important to understand a little bit about your demographics. Luckily, there are many tools out there that are free for you to use. Here are a few ways that you can use analytics to put on a better event, and have a smoother registration process.
Heat Maps
Heat maps are an excellent way to get a good gauge of the geographic range of your participants. A good heat map can show you at a glance if there are locations in your target area that might need a larger marketing push. A heat map can also show you where your best participants are coming from; perhaps there is a town or region where your event is very popular!
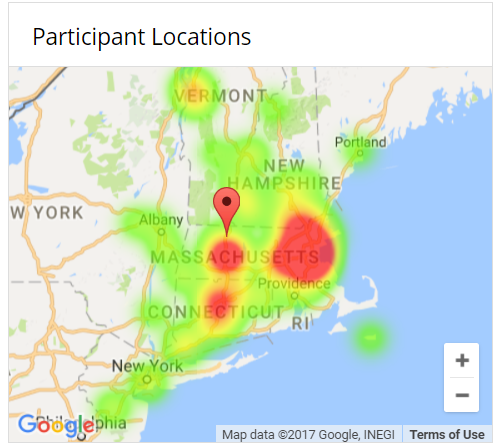
If you are using an athleteReg registration platform you can find your participant heatmap in your Event Dashboard.
Previous Year Comparisons
Using a comparison chart to map this year’s registrations to a previous year’s event is also a great way to show if you’re on track, or if you are under or over-performing in comparison to that year. In the below example, the event is close to being done with its registration, but it looks like in the previous year, there was a final burst right before registration closed; the promoter can look at this year’s registration with confidence, and worry less about what looks to be lower numbers, knowing that they will probably get that last-minute surge again.
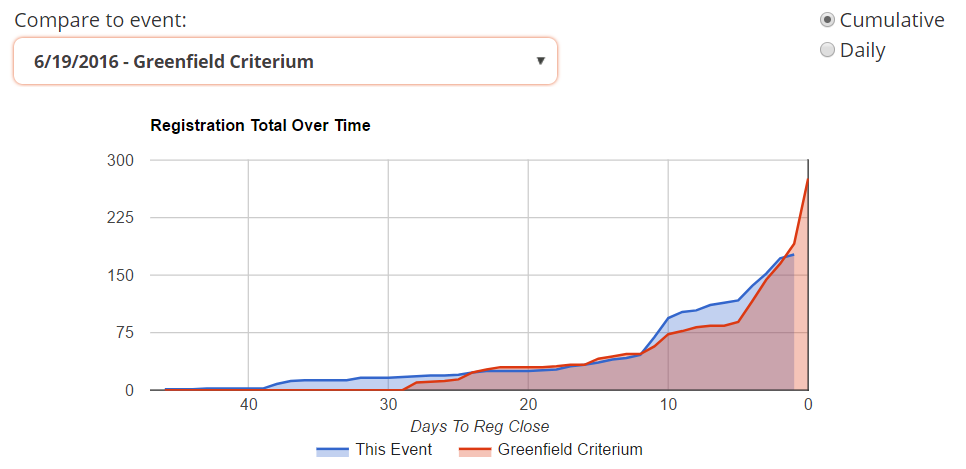
On an athleteReg registration site you can find your participant comparison chart at the bottom of the Registration Summary.
Referrals
Referrals in a marketing context are the websites that your participant came from before they landed on your registration page. It’s important to check out your referrals every once in a while, to see who is driving traffic to your registration; you may be surprised by the results. For example, it’s common to see Google or a similar search engine listed as a top referral, as participants who already know your event may be looking for it there, but you might also find referrals from a local club’s website, or from an affiliated sponsor.
You can look at referral websites on an athleteReg registration site by clicking on Analytics; your top referrers will be listed out. Other analytic platforms will also show you referrals, such as Google Analytics, but these would need to be setup beforehand.
Using these tools will give you a better idea of how people flow through your registration site, knowledge that you can use to better market your event, or just better understand your participants. Good luck with your next event and if you have any questions, let us know by emailing us at Support@athleteReg.com.
*All screenshots and examples are from the 2017 Greenfield Criterium and were used with permission by the event director. The Greenfield Crit is produced, in part, by one of our developers here at athleteReg.